


Warming, cooling, or we don't know?
What to ask your climate scientist friend about the water cycle and global temperature

In a recent post, “Why It Is Important to Read Scientific Papers Beyond Their Abstracts“, I noted that as the human brain has a limited information processing speed, if most of the incoming information is about carbon dioxide, other important problems of the human predicament, water in particular, will remain dangerously understudied. In my post today, I will add specificity to that statement.
I will discuss two peer-reviewed studies published in the same mainstream journal (Journal of Climate of the American Meteorological Society, AMS) in 2010 and 2021. Both studies use global climate models to address one and the same problem. While they come to opposite conclusions, the later study does not look into the discrepancy with the earlier one. Furthermore, the results of the earlier study, without discussing its discrepancy with the later one, are then used in a 2023 report by the World Resources Institute that aims at a broad audience, including policymakers. None of the studies attempt to approach the problem from first principles, but confine themselves to discussing the outputs of numerical models, for which, therefore, there are no independent constraints.
But first, what’s the problem?
Let us take a look at how we’ve recently changed the face of the Earth.

This graph describes the replacement of primary ecosystems by anthropogenically modified systems (data from Hurtt et al. 2011). Since 1800, the area occupied by primary ecosystems has halved. They no longer dominate over land.
Where natural forests have been replaced by agricultural fields, it looks like this:

One can notice that, deprived of vegetation, the Earth’s surface becomes brighter. Solar energy no longer cascades via complicated biochemical channels to energize the biotic maintenance of environmental homeostasis. Instead, unclaimed by life, it is reflected back into space. Yes, other things being equal, this cools the planet. But what are those other things, and are they equal?
During photosynthesis, green leaves release a lot of water vapor. When a leaf opens to catch a CO2 molecule, water vapor flows out from the leaf’s humid interior into the atmosphere. This process is called transpiration. When forests are replaced by bare fields, transpiration is greatly reduced.
Since our atmosphere can only hold a limited amount of water vapor (which condenses back to liquid when its concentration goes over the limit), precipitation and total evaporation (which includes transpiration) are closely matched on the timescale of a few days. When transpiration is reduced, precipitation is reduced as well.
Our question is as follows. What will happen to the Earth’s mean global surface temperature if we diminish the intensity of the global water cycle by disturbing primary vegetation and reducing transpiration over land? As I discussed in the opening post on this blog, “Global cooling from plant transpiration” (see also the corresponding peer-reviewed study), there is plausible evidence that the effect can be significant. Indeed, given that global evaporation corresponds to a global mean energy flux of 80 W/m2, by decreasing evaporation by 20% over half of the land, we could perturb this flux by about 3%, or by 2.4 W/m2, which is comparable to the current radiative forcing from CO2. In my view, this question is so fundamental to understanding our climate system that one would expect it to be in textbooks. That is not the case.
Let us look at what the scientific literature has to say and how it approaches this question. The study of Davin and Noblet-Ducoudré (2010) uses a state-of-the-art global climate model (the one used in IPCC scenarios) to compare two hypothetical states of the Earth. In one simulation (FOREST) all land except modern deserts is covered with forests. In another simulation (EVA) all land has the same albedo and roughness as in FOREST, but has a much lower transpiration efficiency corresponding to a grassland.
This suppression of transpiration results in widespread warming on land, see the left panel (EVA-FOREST). Besides, it produces a global warming of 0.24 K.
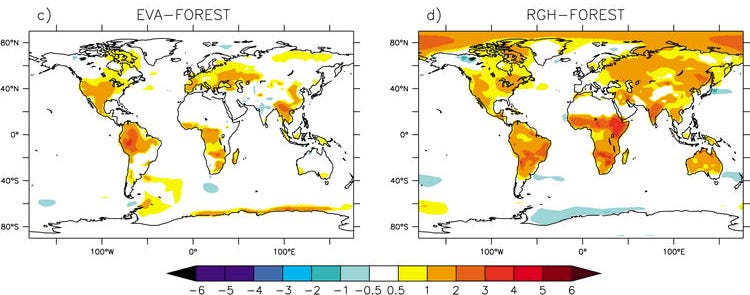
Importantly, there is not practically any change of the outgoing long-wave radiation between the two states. This means that this global warming from suppressed transpiration cannot be attributed to changes in albedo (e.g., due to changing cloud cover).
The authors attribute this global warming to an "internal redistribution of energy in the climate system". Its nature is not specified — like for example we know that CO2 warms the Earth by trapping thermal radiation, but how does an internal redistribution of energy warm it? Nor any considerations are presented that could independently constrain the magnitude of the resulting warming and validate the model outcome.
Without a deeper understanding, even among the scientists themselves, of what the underlying mechanisms could be, messages based solely on numerical model outputs are circulated and communicated to the public and decision makers. One of the key figures in the 2023 report of the World Resources Institute “Not just carbon” ,

Fig. 2.5 “Modeled CO2, Biophysical, and Net Impacts by Latitude of Global Forest Loss”, is based on the results of Davin and Noblet-Ducoudré (2010). The yellow “ET” bars in the left panel represent the latitude-dependent warming due to reduced evaporation and transpiration as found in their model.
The second study, of Laguë et al. (2021), uses a simpler global climate model where one can freely configure the shape of the continents. Fully suppressing evaporation on a hypothetical land that covers 1/4 of the planetary surface, they also obtain warming on land but a global cooling of -0.4 K. Warming over land is more than compensated by cooling over the ocean.
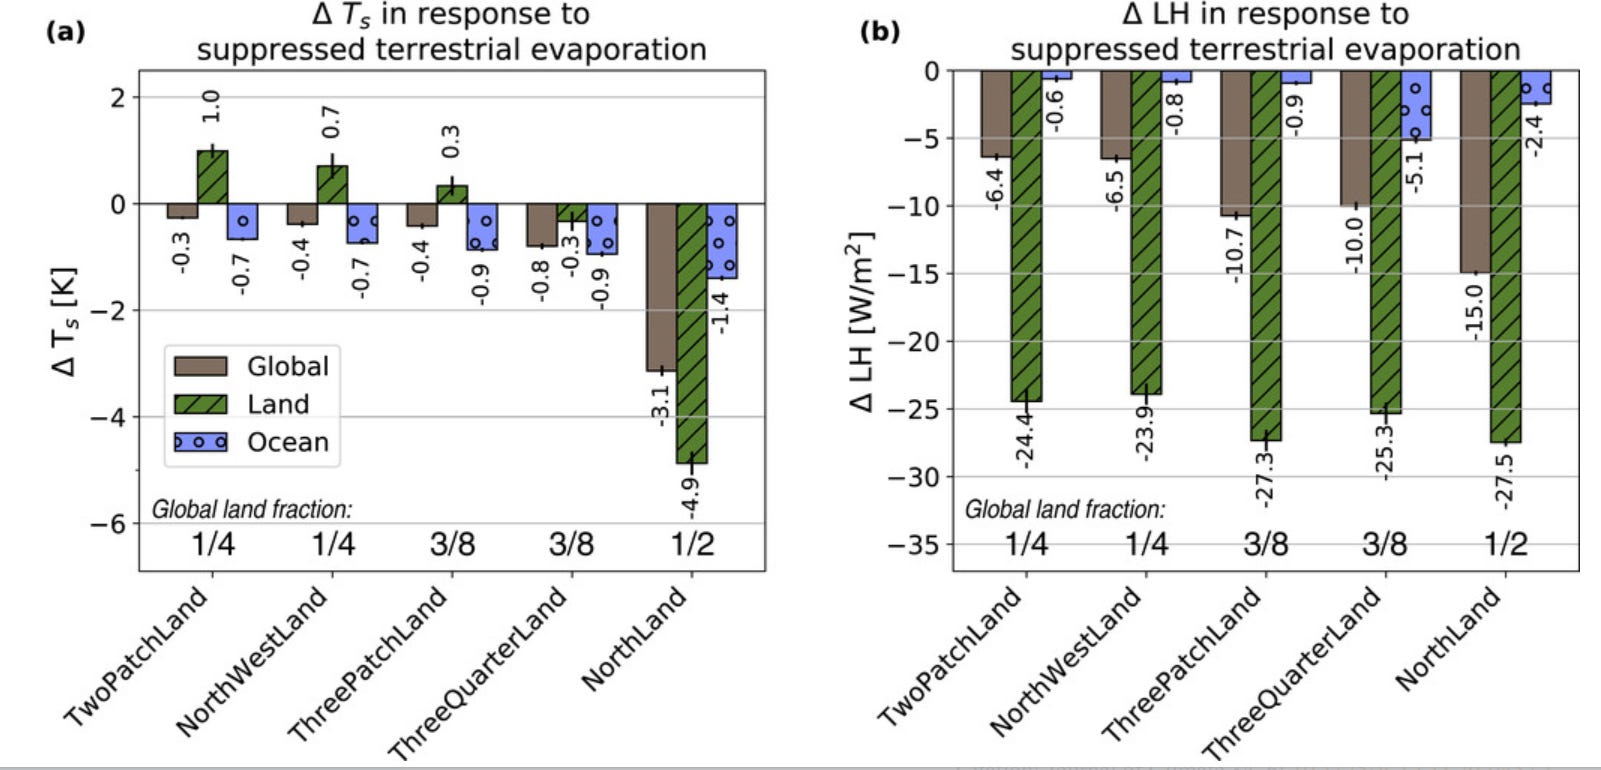
The authors attribute this global cooling to there being less water vapor in the atmosphere, and hence a lower greenhouse effect, when evaporation is suppressed. While they mention the 2010 study in a row of studies addressing similar problems, they do not discuss the discrepancy between their own study and the earlier one. In the 2010 study, evaporation was also suppressed, but apparently this did not produce a lower greenhouse effect, since the planet warmed as a whole.
Imagine for a moment that one study in an AMS journal reported warming from increased CO2, and another reported cooling from increased CO2 without discussing the results of the former. Yes, it is unthinkable. The second study would not make it to publication in the first place. This is (partly) because, as far as CO2 is concerned, besides numerical models there have always been theoretical considerations based on well established physical principles that allow an independent check on model outputs. With respect to the impact of vegetation on the Earth’s global surface temperature such independent theoretical considerations do not exist nor are there any large-scale efforts to develop them.
This situation is unsatisfactory. If an "internal redistribution of energy in the climate system" can warm our planet, we absolutely need to know whether we understand its nature and get it quantitatively right.
I am positive. At a certain moment people will massively get tired of just trying to decipher the meaning of another simulation produced by an ever more sophisticated climate model and will again champion thinking. Another positive factor could be that, as the models become more and more sophisticated and computationally consuming, fewer and fewer researchers will be able to actually oversee and use them, let alone modify according to their research needs. For the remaining community, a re-prioritization of other research methods, including theory development, will become more attractive. As a recent Perspective puts it,
“State-of-the-art models, observational systems and machine learning are transforming our ability to simulate, monitor and emulate many aspects of land climate. Our scientific understanding, however, has not kept pace, and we now lack robust theories to comprehend the rich complexity being revealed by these advanced tools. Now is the time to change course and underpin models, observations and machine-learning techniques with new theories so that we maintain and advance the deep, mechanistic understanding of land climate needed to meet the challenges of an uncertain future.” (Byrne et al. 2024)
Cited references
Byrne, M.P., Hegerl, G.C., Scheff, J. et al. Theory and the future of land-climate science. Nat. Geosci. 17, 1079–1086 (2024). https://doi.org/10.1038/s41561-024-01553-8
Davin, E. L., & de Noblet-Ducoudré, N. (2010). Climatic impact of global-scale deforestation: Radiative versus nonradiative processes. Journal of Climate, 23(1), 97-112. https://doi.org/10.1175/2009JCLI3102.1
Hurtt, G. C., Chini, L. P., Frolking, S., Betts, R. A., Feddema, J., Fischer, G., ... & Wang, Y. P. (2011). Harmonization of land-use scenarios for the period 1500–2100: 600 years of global gridded annual land-use transitions, wood harvest, and resulting secondary lands. Climatic change, 109, 117-161. https://doi.org/10.1007/s10584-011-0153-2
Laguë, M. M., Pietschnig, M., Ragen, S., Smith, T. A., & Battisti, D. S. (2021). Terrestrial evaporation and global climate: Lessons from Northland, a planet with a hemispheric continent. Journal of Climate, 34(6), 2253-2276. https://doi.org/10.1175/JCLI-D-20-0452.1
Makarieva, A. M., Nefiodov, A. V., Rammig, A., & Nobre, A. D. (2023). Re-appraisal of the global climatic role of natural forests for improved climate projections and policies. Frontiers in Forests and Global Change, 6, 1150191. https://doi.org/10.3389/ffgc.2023.1150191
Thank you, Anastassia.
"It's all models, all the way down", as the saying might be restated.
;-(
https://en.wikipedia.org/wiki/Turtles_all_the_way_down
Dear Anastassia,
A LOT to absorb in this substack!
I could not agree more about the World’s focus on the single issue of CO2 – while ignoring the destruction of our soil, our forests and the depletion of our under-ground water. A shortage of water will be our undoing long before Climate Change REALLY kicks in.
In that graph showing the decline in Primary Vegetation, would you be able to give some examples of Primary vegetation < 2kg C/m2? I assume greater than 2 would be the rain forests of Amazon, Congo and the Far East? Would the sub-tropical woodland savannas of Africa fall into the >2 or <2 category? Your boreal forests of the far north? In that graph, what is the difference between the dark maroon and pink classes of disturbed vegetation?
Solar energy falling on cleared land is “unclaimed by Life” is an absolutely brilliant phrase.
“Precipitation and total evaporation (which includes transpiration) are closely matched on the timescale of a few days”. I had assumed that, in southern Africa, the timescale, particularly at the start of our rainy season, would be over a longer time scale of at least several weeks. Some of our “wise” indigenous trees come out into fresh, transpiring leaf in mid-August even though our rains cannot really be expected until late October/early November
“We could perturb this flux by about 3%, or by 2.4W/m2” sounds almost insignificant, but what one has to remember is that energy flux is cumulative. The best illustration of this is that the sun produces heat at the same rate PER UNIT OF VOLUME as the average human digestive system! This small increment of heat from every liter of volume in the sun adds and adds until the total produces the radiation that powers our solar system.
“has a much lower transpiration efficiency corresponding to a grassland”. Is this much lower efficiency of grassland a feature of the seasonality or is it that, even in the middle of a summer growing season, a grassland cannot transpire as much moisture as even a <2kg C/m2 woodland? This is an important point for me to understand – and then to disseminate throughout my community.
I will have to revisit the EVA-FOREST and RGH-FOREST maps as I don’t really understand the point you are trying to make here. What does RGH stand for?
At least those maps can show me where the latitude bands extend to in the next graph. If I read it correctly, deforestation from 50-70N would cause a combined impact of cooling by about 0.4 deg C, while deforestation around the equator including as far South as where I live (15S) would produce an impact of +0.2to+0.4deg C. Why the difference? How important is it to bear in mind that the 10N-10S latitude covers far more of the earth than 50N-70N? I don’t have time to check how much actual land there is in these latitudes, which is obviously an important consideration. I would hate to see any policy (formed on the basis of this graph) that advocated the deforestation of your boreal forests!
“Warming over land is compensated by cooling over the ocean” as a result of suppressing evaporation over a landmass equivalent to ¼ of the earth’s surface. What mechanism explains this, and why does the temperature response change dramatically with the ½ northland, while the Latent Heat flux doesn’t change that significantly through the five different scenarios? This diagram raises (in my mind) more questions than answers!
“I am positive. . . . . . and will again champion thinking”. I love that. Following a terrible drought last (2023/24) rainy season in southern Africa, we are all (naturally) somewhat concerned that we might get a repeat this (2024/25) season which is currently still well below average in terms of rainfall, although we haven’t had the scorching dry weather of last year (yet!) (I recommend interested readers visit the Zambezi River Authority website that shows levels of the Zambezi and Lake Kariba a major source of hydro-electric power for both Zambia and Zimbabwe.) As a result many of us are following various weather forecasting websites and we are mostly very frustrated as they are all, without exception, proving to be hopelessly optimistic, predicting much more rain than actually falls. There was some hope that since Google had made their AI available to the weather forecasters, that the forecasts would become significantly more accurate. I countered that, because their forecasting was based on historic data, it would not compensate for the deforestation, soil degradation and water-table depletion that has taken place in the last few decades. Garbage In still produces Garbage Out, even when supervised by an AI, so, until we run models that include these parameters we can continue to expect poor weather forecasts, and inaccurate Climate Models.
Enough! Bruce Danckwerts, CHOMA, Zambia