
China at an Ecohydrological Crossroads, Part II: Common Assumptions
When vegetation is assumed to affect water use but not air circulation, re-greening is predicted to reduce water yield by construction, regardless of what happens in the real world

We pick up the story where we left it in Part I: Basic Notions. Our ultimate goal is to understand how the widespread re-greening that took place in China in recent decades could change the hydrological cycle. At the end, I return to several thoughtful comments prompted by the previous post, for which I am very grateful.
In Part I, we discussed why it is so difficult to measure the invisible part of that cycle, especially evaporation and transpiration.
With plants in pots, this would be easy. They evaporate and transpire exactly as much water as we pour in.

But it is different for plants growing in soil. Unlike in a pot, not all water that enters the soil returns to the atmosphere. Some of it leaks downward and ultimately returns to the ocean. We cannot see how much water escapes from beneath a particular plant. We can only say that, in a steady state, when the plant is not depleting soil moisture, it transpires less water than the atmosphere delivers as rain.
Now suppose we did our best. We covered the territory in question with multiple rain gauges to measure precipitation P, which, as Bruce Danckwerts reminds us from Zambia, can be very far from spatially uniform. We measured the streamflow of the river draining this territory to estimate runoff R. And we continued these measurements long enough for soil moisture to equilibrate, so that dS/dt = 0.
In this case, we can estimate the average evapotranspiration over the territory from mass conservation, the simple fact that water does not disappear into nowhere:
E = P − R.
Both P and R come with their own uncertainties. For E, which is deduced from P and R, these uncertainties accumulate, making evapotranspiration the least certain of the three estimates.
Some additional constraints, however, come from atmospheric data. This brings us to a peculiar data-model hybrid called reanalysis. Reanalyses play an enormous role in modern environmental research. To judge how robust a given conclusion or prediction is, we need to understand what they are, and what they are not.
The Reanalyses Miracle
As we discussed in Part I, the water budgets of the atmosphere and the ground are tightly linked, but not symmetrically. The atmosphere is a net supplier of moisture to land: it draws water evaporated from the ocean inland and delivers it to the ground as rainfall. The ground is a net loser of moisture: part of the received water runs off under gravity and ultimately returns to the ocean.
Over our territory, we can measure the winds that bring moisture in and the winds that carry moisture away. The difference between the two is the net moisture import into the region, called atmospheric moisture convergence C. In a steady state, this surplus must equal what the ground loses as runoff:
C = R.
One useful feature of wind fields is that they can be constrained by satellite observations, giving us a global picture, including regions where direct runoff measurements are sparse or unavailable. So, when we talk about a region as large and varied as China, we cannot be too choosy. We need to consider the water cycle from both sides and use all available data: from the atmosphere above and from the rivers below.
To combine these many imperfect pieces of evidence, scientists use reanalysis products. A reanalysis gathers diverse observations, combines them with a weather model, adjusts the result toward physical consistency, and places the estimates on a regular grid, usually about one degree latitude and longitude in resolution. It is not a pure observation, and not a free-running model either. It is a data-model hybrid that gives us the best available estimate of many atmospheric variables at each location and time.
Because the optimization criteria for combining observations with the model can vary, different reanalysis products can give different estimates of the same variable. Each product reflects a particular way of blending imperfect observations with physical constraints. Once this blending is done, the end user receives something almost miraculous: a detailed global picture in which wind, temperature, humidity, pressure, rainfall, evaporation, and many other variables are available for almost every place and time.
The underlying uncertainties and mismatches do not disappear, but they are hidden from view. One can download various variables and use them directly in further analysis. This is enormously convenient, but it also means that the assumptions built into the product can quietly travel into later conclusions.
In this sense, using a reanalysis is a little like placing money in a managed fund. You may receive a tidy number at the end, but the choices that produced it, and whether you are comfortable with those choices, are not always clear unless you look carefully.
(For a more specific discussion of different reanalysis products in the context of the soil moisture budget, see “We Are Losing Soil Moisture, Why?)
Assumptions about Re-Greening Impacts
But even if we decide to take reanalysis data at face value, this is not the end of our problems. Suppose our territory has been re-greening for decades, while rainfall, evaporation, runoff, winds, and moisture convergence have all been changing too. Which changes are caused by re-greening itself, and which come from the larger climate system moving in the background?
This is a fundamental question.
A common approach, adopted also by An et al. (2025), whose work we began to discuss in Part I, is to assume that the effect of added vegetation consists of returning more moisture to the atmosphere through enhanced transpiration. We can call this the moisture-recycling approach.
Since transpiring more is precisely what extra vegetation is expected to do, the limitation of this assumption is not immediately obvious. However, this assumption unambiguously predicts reduced runoff when transpiration increases. To see why, let us follow the research scheme of An et al. (2025).
Their analysis starts by defining added evapotranspiration. Each vegetation type is assigned characteristic evapotranspiration values at each time step. So, if grassland is converted to forest, the re-greening effect is calculated as the difference between two estimates: the actual evapotranspiration of the forest and the hypothetical evapotranspiration that the original grassland would have had under the same local conditions.
Thus, the actual evapotranspiration can come from the reanalysis, but the re-greening effect is not simply the observed trend. It is the difference between the new vegetation and a reference version of the old vegetation. Therefore, trends in actual evapotranspiration and in added evapotranspiration need not coincide.
Once this added evapotranspiration is defined, the corresponding change in precipitation is estimated with a moisture-tracking model. In plain language: the model marks the extra moisture released by the new vegetation and follows where it rains out within China.
Now comes the crucial point: some of the extra moisture released by the new vegetation can leave China without raining out there. Therefore, in this framework, the re-greening-related increase in precipitation, ΔPᵣ, cannot exceed the corresponding increase in evapotranspiration, ΔEᵣ:
ΔPᵣ ≤ ΔEᵣ.
Here we recall our water budget equation:
R = P − E.
If re-greening changes precipitation by ΔPᵣ and evapotranspiration by ΔEᵣ, and the latter is larger than, or equal to, the former, then runoff R changes by:
ΔRᵣ = ΔPᵣ − ΔEᵣ ≤ 0.
In other words, in this setting, runoff can never increase.
The added vegetation is assumed to return more water from the ground to the atmosphere. Some of this water may rain out again inside China, but some may leave the country as atmospheric moisture. What is not allowed in this scheme is the opposite effect: re-greening being associated with additional moisture drawn from outside. With that possibility excluded, the water available for runoff can only stay the same or decline.
This result follows from the way the problem has been framed. It is not, by itself, evidence that runoff actually declined in the real world.
This distinction is important. The work of An et al. (2025) was widely understood as referring to actual changes in precipitation ΔP, evapotranspiration ΔE, and water availability or runoff ΔR observed in China during the decades of re-greening. In fact, however, these statements refer to hypothetical changes in these variables, ΔPᵣ, ΔEᵣ, and ΔRᵣ, calculated under the moisture-recycling assumptions described above.
What actually happened in China during these years is a separate question. We will turn to it in the next post.
Re-Greening and Moisture Convergence
Let me now summarize what we have discussed so far with a picture.
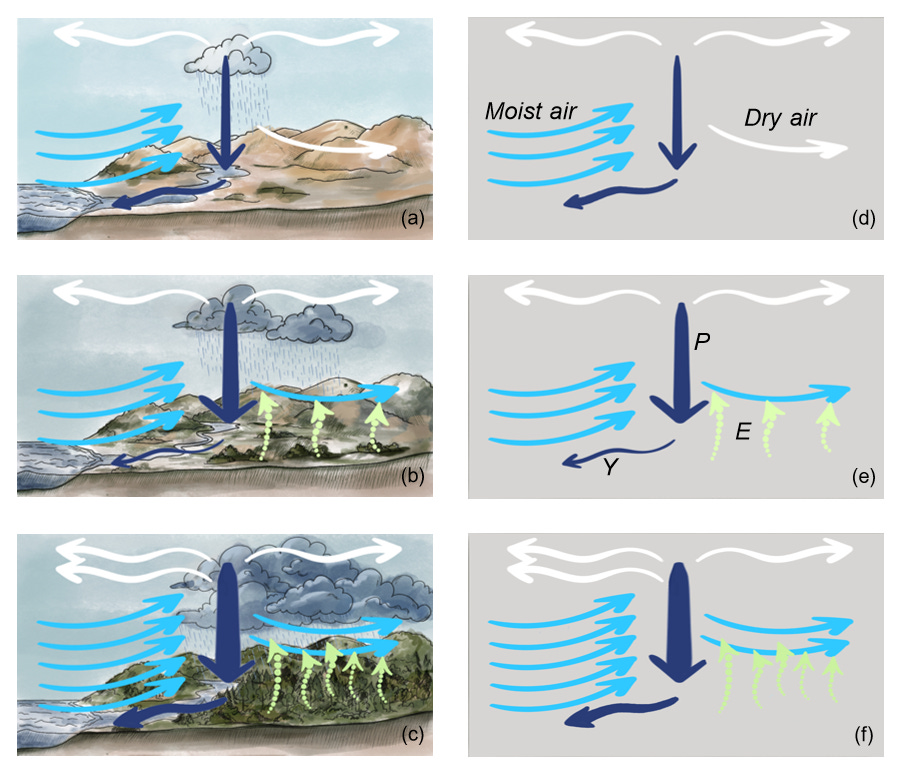
The left and right panels show the same air circulation and water cycle, but the landscape is omitted from the right panels for clarity. Fig. 1 from https://arxiv.org/abs/2604.09510
We first consider desert land bordering the ocean and receiving occasional rain (panels a,d). There is no vegetation and no evapotranspiration. All precipitated water drains back to the ocean. Light-blue arrows show the inflow of moist air that rises and generates precipitation. White arrows show dry air, depleted of moisture, leaving the area. The same number of air arrows enters and leaves. Precipitation P is shown by the vertical dark-blue arrow, while runoff (water yield Y) is shown by the slanted dark-blue arrow.
Now we add some vegetation to the landscape, while keeping air circulation unchanged (panels b, e). Transpiration by plants (E) returns some of the precipitated moisture back to the atmosphere, where it can re-precipitate. Thus, precipitation has increased compared to the desert state: the same amount of air rises per unit time, but it is now wetter, so more rain is generated.
However, because the air has become wetter, some moisture now leaves the area with the outgoing low-level air instead of contributing to runoff. Hence, runoff has decreased relative to the desert state, although it can become more stable, as we will discuss below.
Finally, we consider a state in which added vegetation has moistened the atmosphere enough to change its dynamics: more moisture now flows in with the air and rises over the region (panels c, f). There is also more moisture outflow, just as the Amazon forest moistens agricultural regions downwind. But the net moisture transport has increased, and so has runoff.
Compared with both the desert state and the intermediate state, in this biotic-pump regime both precipitation and runoff have increased.
Outlook
I would like to conclude by discussing a few responses to the above arguments, especially those raised in an open-access discussion in the Eco-Restoration Alliance (with insightful comments from Hart Hagan, Judy Schwartz and Neal Spackman, among others). In particular, Didi Pershouse listed several important water-related effects of vegetation (a related point was raised by Rob Lewis in his comment):
Vegetation generally builds soil’s porous structure, and over time, it builds the structure deeper and deeper, so that more vegetation creates more capacity for soil to hold water in what is essentially a larger and larger in-soil reservoir.
Vegetation reduces soil surface temperature, and reduces evaporation from the soil surface (though this may be offset by increased transpiration?).
And vegetation (especially complex multi-story vegetation) dramatically slows winds, which are drying.
Runoff (and streamflow) alone is not a sign of lack of soil moisture. It is its own signal, and can mean anything from water is not entering the soil at all, or that so much water is in the soil that it is overflowing. The difference between a city storm sewer and a spring popping in the middle of a wet lush landscape. A better question is whether the streams flow year round (if they are fed from underground) or whether they are flashy: high then low with each rainfall.
Here’s a post that covers this and more: What’s needed for land to soak up water?
Let us discuss these points using the same mass-conservation framework with which we have been following the hydrological cycle in China.
There is a positive relationship between soil moisture and subsurface runoff. For a given porous structure and landscape slope, the more moisture the soil contains, the more water can leak downward and drain under gravity.
Dry soils drain little. Wet soils drain more, but they cannot drain more water than the atmosphere delivers. This places an atmospheric limit on how wet the soil can become.
In the extreme case, imagine a devegetated landscape with dry soil, no infiltration, and 100% surface runoff. Without changes in atmospheric circulation, the maximum possible increase in soil moisture storage is limited by the flow of water that can be shifted from surface to subsurface runoff.
Both evaporation and transpiration cool the surface from which they occur. Physically, they are essentially the same process: liquid water becomes vapor by consuming energy.
While reduced evaporation diminishes uncontrolled soil moisture losses from the soil surface, cooling of the surface as a whole means that transpiration and evaporation together (evapotranspiration) have increased compared to the unvegetated state. The cooler and wetter soil sends more moisture to the atmosphere than in the unvegetated state.
If evapotranspiration has increased, but atmospheric moisture transport has not, runoff must decline. Even in the extreme case where the unvegetated landscape had 100% surface runoff, the restored landscape cannot drain the same amount of water if it now sends more water to the atmosphere. Its total runoff (surface and subsurface) must be lower by the amount of increased evapotranspiration.
In summary:
A cooler surface, when caused by increased evaporative cooling, means increased evapotranspiration, which means decreased runoff if atmospheric moisture convergence does not change.
Long-term mass conservation says nothing about how runoff is partitioned in space and time: whether it comes as irregular, mostly surface runoff following irregular rains, or as steadier drainage from wet soil throughout the year.
One could argue that much of the flashy runoff is lost in any case, while steadier drainage is more useful, even if it is smaller in total. In many cases, this is a valid and important argument. Moreover, from the plants’ perspective, runoff is water that was not used for transpiration. It is an indispensable loss, the price of keeping soil moist. Thus, a reduction in runoff does not necessarily interfere with ecosystem restoration itself. It can be a normal initial stage of recovery.
In other human contexts, however, total runoff matters. For example, a hydropower plant may collect streamflow in a dam and use the stored water to generate electricity. Or a dam may collect water for later irrigation. In such cases, the irregularity of flow may matter less than the total volume of water that arrives. This becomes especially relevant when restoration efforts scale up and their hydrological impact can be felt at the regional level.
The same logic applies to beavers. They slow water down and moisten the soil locally, which can increase vegetation and transpiration, shifting part of the water route from streamflow to the atmosphere. If atmospheric circulation does not change, this will reduce the streamflow that reaches people downstream. There is little point in arguing whether beavers and the associated vegetation “contribute water” to the watershed without explicitly defining what “contributing” means.
There is much confusion around the terms “water availability,” “water yield,” and “runoff,” which I tried to clarify in Part I. How much moisture the soil contains is one variable. How much water an area drains is another. In some cases, they are positively related. In others, they can change in opposite directions. Increased rain is not equivalent to increased runoff. Removing trees that “steal water” at early stages of ecosystem recovery may permanently lock the ecosystem in a desert state. More about that in the next post.
The bottom line is that we cannot understand the water cycle, or its changes, by focusing only on the soil, only on the atmosphere and winds, or only on streamflow. Nor can we communicate this complex subject clearly to our peers without being explicit about these different components. We need to see how they relate to one another, and how vegetation interacts with all of them. This can help avoid unnecessary controversies when navigating the complex landscape of different stakeholder interests and advocating vegetation-mediated water-cycle restoration. It is also essential for my primary concern: the preservation of extant water-competent ecosystems. Simply understanding what the other side means can make our own narrative more accurate and constructive.
If ecological restoration produces a cooler and wetter area that drains more water than it did when devegetated, this means that more moisture has been brought in by the atmosphere. The biotic pump has been activated.

Related reading:
Thank You, Anastassia for passing over this essential content from so many different approaches, that there is effectively some way that you are saying it for anybody who really wants to understand.
Can anyone explain this paradox? https://doi.org/10.13140/RG.2.2.36466.82885 (page 6)
An attempt to check satellite data on precipitation leads to a dead end - if we calculate the sum of integral water content for all heights and estimate it by the average period of moisture circulation in the atmosphere (7-10 days), we get precipitation value of several mm (here 2.96 mm per year), while in reality it is about meters (510 mm per year for Ashdod). I.e. 2-3 orders of magnitude of moisture is lost somewhere! The satellite flew over this area (~ degree by degree) 44 times in 2008, and I take 100 points for each flyby, i.e. a sample of ~4400 points. From them I calculate the average cloud water content for each layer (240 m height). Accordingly, I get some quasi-stationary average water content, summarize it and try to calculate what the precipitation rate will be, assuming that this water content falls as rain about once every 7-10 days (according to the approximate period of the hydrological cycle). There seems to be no logical error, but the result is discouraging. Obviously, real satellite data on cloud water content gives a paradoxically low value for the same real precipitation data! So, how to calculate precipitation correctly from integral cloud water content? I have asked this question on my blog, to well-known climatologists, and even on the NASA forum, but I have not received an answer from anyone.